DevOpsactiveFEATURED
Smart Signage Dashboard
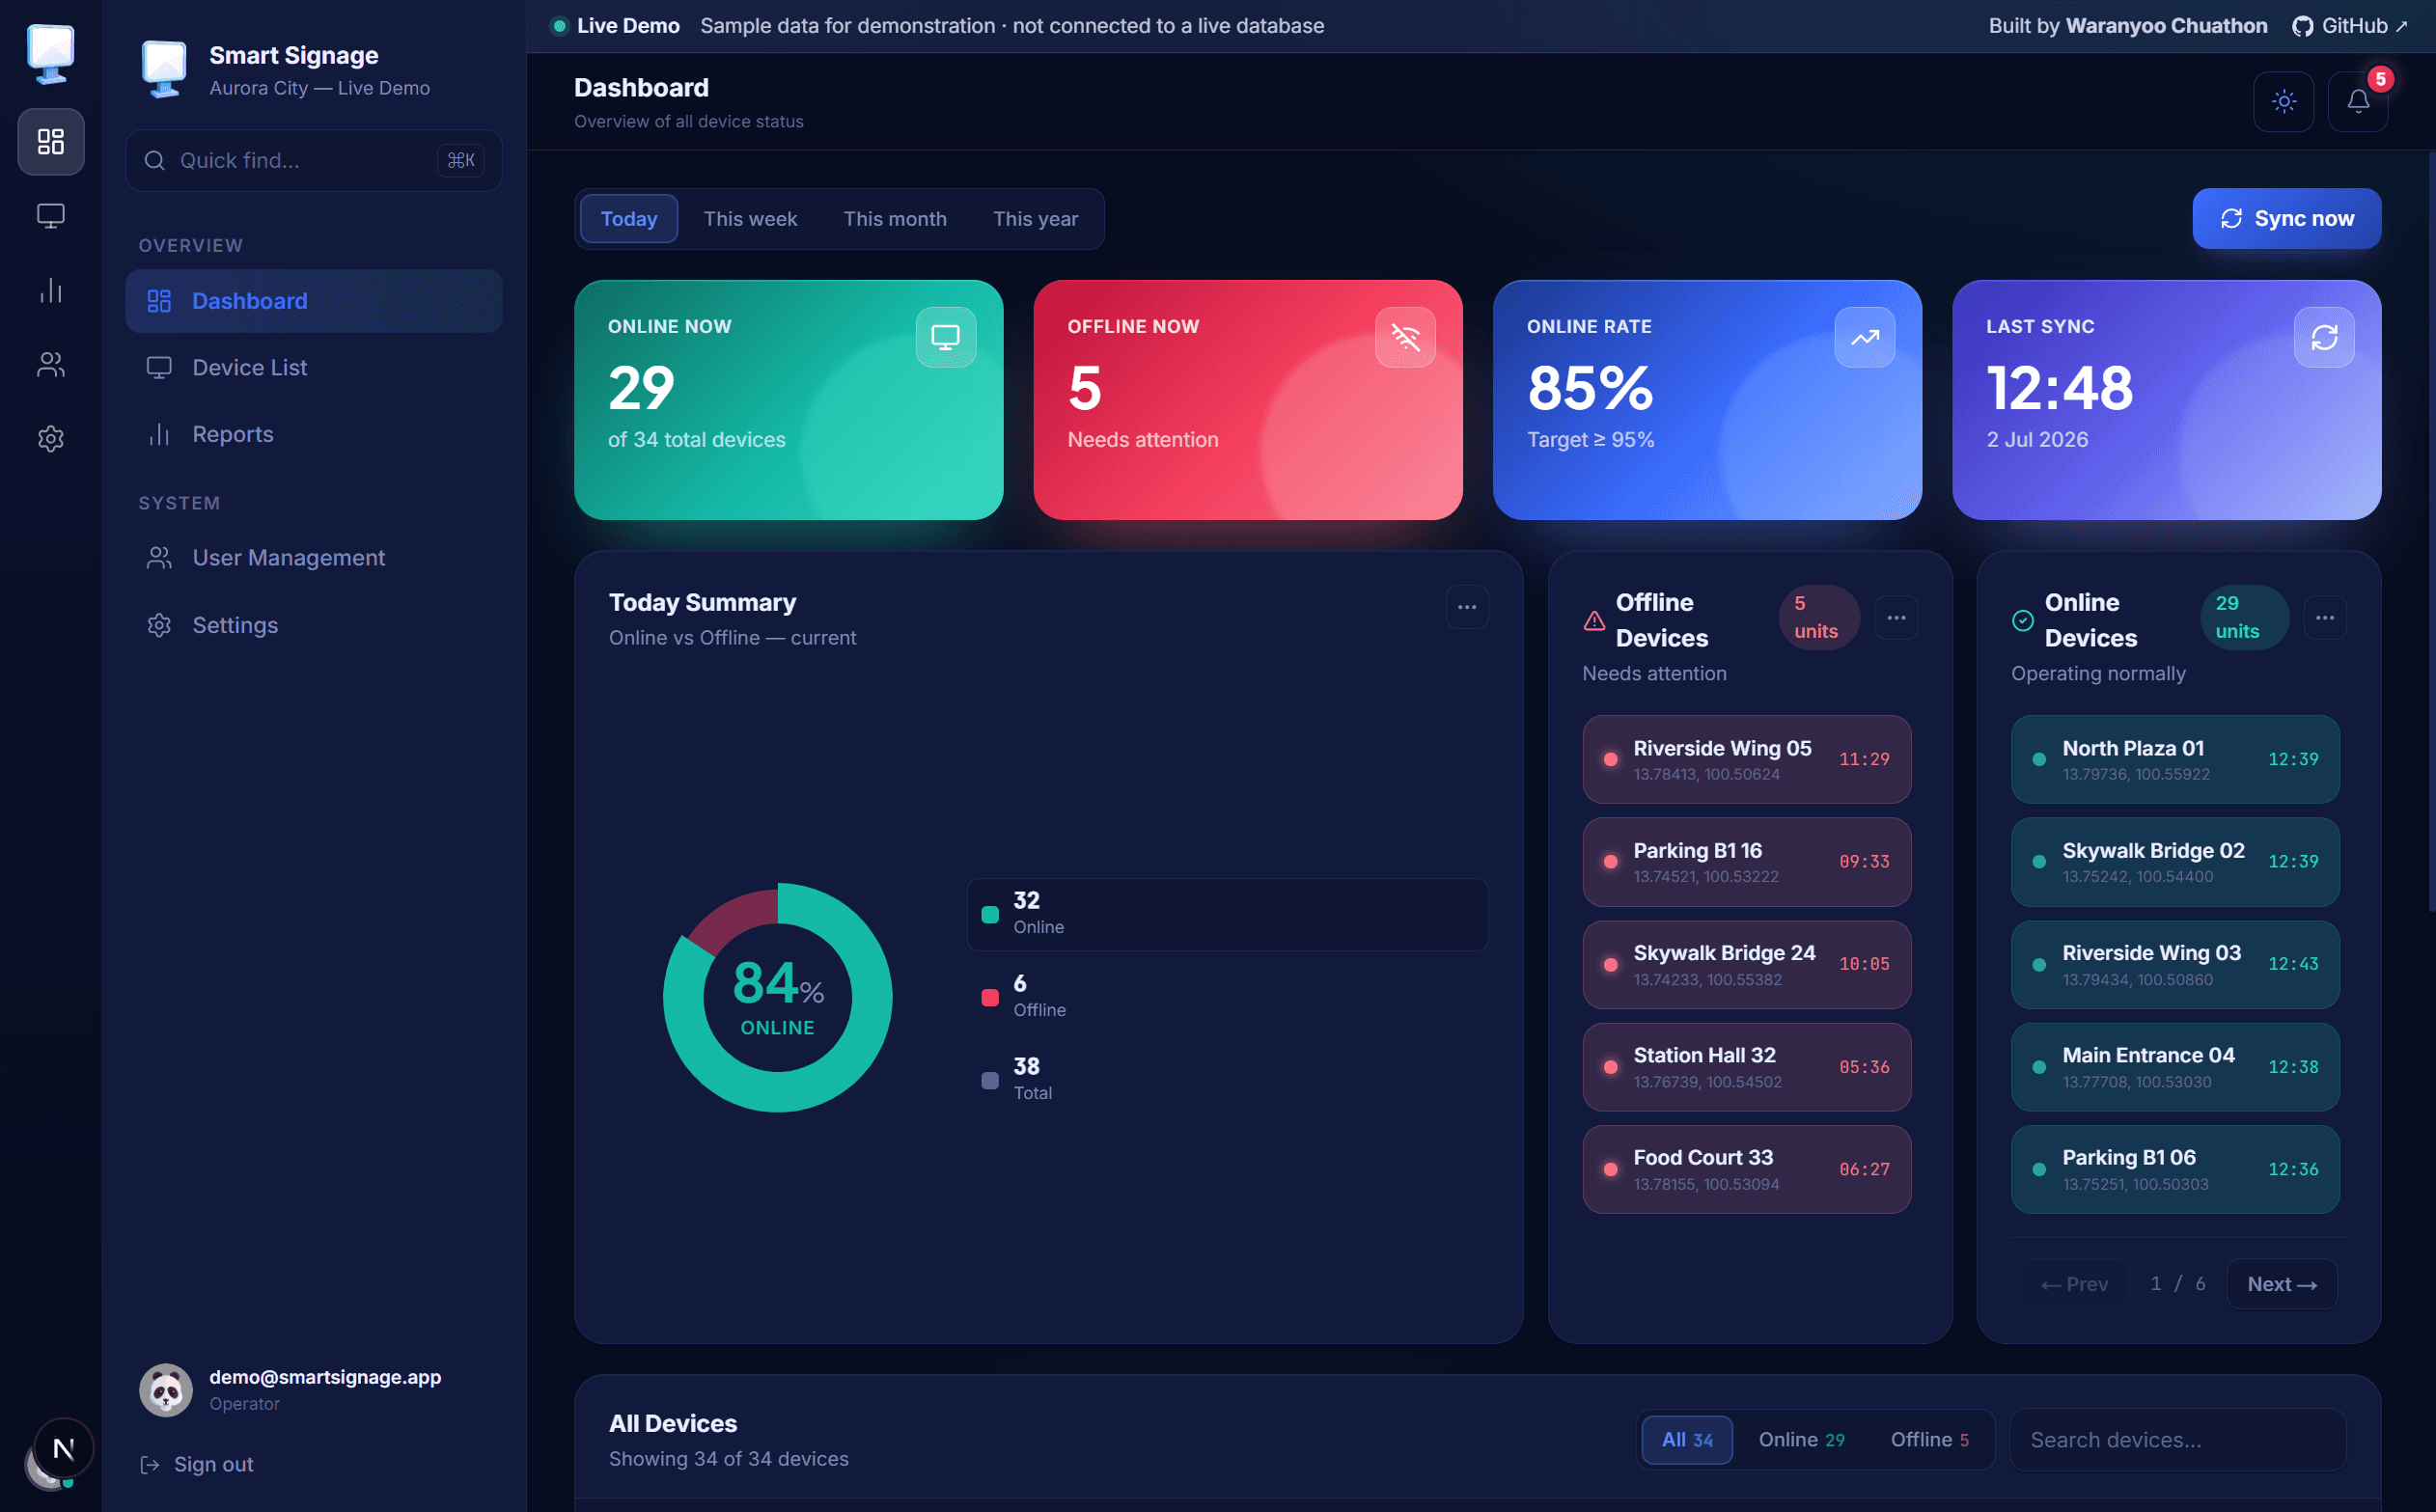
Built for an operations team watching dozens of signage displays at once: KPI cards for online/offline/uptime rate, a daily donut chart, a day/week/month/year trend chart, and searchable device lists with a detail side panel. Reports rank devices by uptime and export to CSV; user management supports role-based access (Super Admin / Admin / Viewer). All charts are hand-written SVG — no charting library. Production data comes from Supabase via RPC functions; the public demo swaps in a mock client mirroring the supabase-js interface end-to-end, so the same UI code runs identically with zero environment variables or secrets.
Technologies Used
Next.jsTypeScriptSupabasePostgreSQL